
DocuLink 🔗⭐️
DocuLink is an application that visualizes the relationships between documents in Confulence, helping users discover connections and access key document information through an interactive graph.
https://youtu.be/Qb_DmEHbbCs?si=yUJ0jcBw-vo_3tAH
Inspiration
DocuLink is inspired by Obsidian, which visualizes data through graphs. Obsidian does an excellent job of showing the relationships between personal data, but its focus is on individual use. On the other hand, Confluence stores all the crucial company data, and this data is created collaboratively by coworkers. This means that data can sometimes be fragmented, making it harder to connect the dots across different teams and departments.
For example, one department may create documentation about a new product feature, while another might write a similar document without knowing about the first one. This leads to duplicated efforts and confusion.
Our goal with DocuLink is to solve this problem by showing the relationships between documents, enabling users to quickly discover relevant connections and avoid redundant work.

What it does
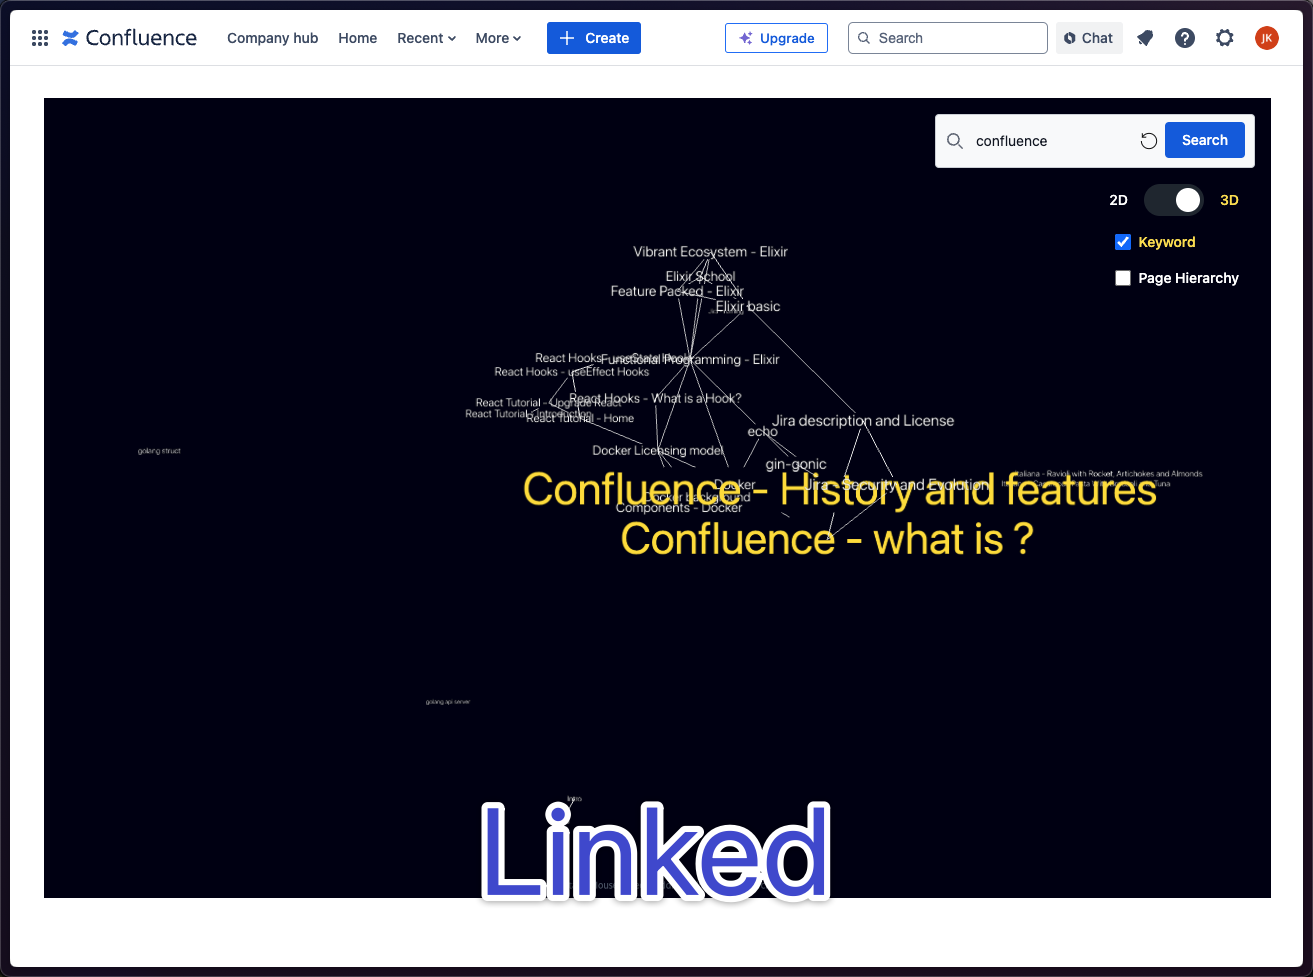
Graph Visualization: Displays a 2D or 3D graph that connects documents, showing their relationships in a visually intuitive way. This allows users to easily navigate through the network of documents and understand how different pieces of content are related.
Search Results Display: When a user performs a search, the search results are highlighted directly on the graph, making it easy to find relevant documents and see their connections within the broader context.
Document Information: When the user hovers over a node in the graph, important information about the document (e.g., title, author, created date) is displayed. This provides quick access to key details without needing to open each document individually.

How we built it?
We built the Confluence application using Forge, a platform that provides basic examples and makes it easy to develop apps quickly. This was a great help in speeding up the development process.
We used Forge’s scheduledTrigger to analyze Confluence documents and detect links between them. The identified documents and their links were then stored in a storage system. We developed an API to serve this stored data to the frontend.
On the frontend, the data is used to visualize the relationships between documents in the form of an interactive graph, making it easy to explore and understand how different pieces of content are connected.
Challenges we ran into
More Diverse and Accurate Document Connections: It was challenging to extract meaningful links from Confluence's diverse and complex document structures. We addressed this by using multiple link categories. Since it was difficult to extract a large number of meaningful connections using just one category, we worked on extracting an appropriate number of links across various categories.
Clear UI: As the number of document connections increased, the graph became more complex and difficult to read. To solve this, we introduced a search function that allows users to more easily find the information they want to see.
Built With
- forge
- javascript
- react
'💻 개발공부 > Project' 카테고리의 다른 글
| [Spring Boot Project] Jambo! 🐘 ( JPA, AWS ) (0) | 2023.02.06 |
|---|---|
| [Jsp & Servlet Project] A+Store 🍎 - 애플 제품 쇼핑몰 (0) | 2023.02.06 |
| [Java Console Project] ReMovier 🎬 - 영화 리뷰 프로그램 (0) | 2023.02.06 |